
With the increasing use of data in football, there is always a need to introduce better ways to evaluate a team or a player’s performances on the pitch. One such area is pressures.
“Pressing from the front” and “Gegenpressing” have become the go-to words to describe the identity of most successful teams nowadays. Therefore, it is only fair that their are more advanced metrics coming everyday to accurately gauge how good a team is at pressing.
These metrics determine which teams play defensive and which one goes on the offensive. However, measuring pressures may be easy, but quantifying and correlating it with the effect on a team’s play is rather difficult. And thus, we have two metrics, the Passes Allowed Per Defensive Action (PPDA) and the Build-up Disruption Percentage (BDP).
Earlier, the sole metric used was PPDA which measured how many passes a team made for every defensive action. So, a team with lower PDDA was playing an attacking style of football which included pressing the opposition’s team in their half.
However, one of the significant problems with PPDA was that it only showed whether a particular team was pressing or not. Therefore, whether the team with the higher pressing was successful in winning the ball or disrupting the opposition’s team play could not be found through PDDA.
What is Buildup Disruption Percentage (BDP)?
The Buildup disruption percentage, or BDP as it is commonly known, measures the impact that a team’s pressure has on the passing of the opposition’s side. For example, if a team is playing an intense high, pressing system, it will cause the rival team to register fewer passes as the high pressure.
But how do we measure BDP?
Soccerment, which developed the statistic, have explained the maths behind it. First, the system calculates the team’s passing completion rate. Then it compares it with the average passing completion rate of the team in that season. This difference is then compared with the computable difference of the other team. The resultant number is further weighted against the opposition’s team passing accuracy to conclude the effectiveness of the press. The number of the sign is then changed.
For about the past year and a half I've had some issues with some of the grey areas left by PPDA and/or pressures. The new BPD metric suggested by @toni_Gagliardi and @Soccerment_Blog uncovers these#Juric, #Tudor and #Baumgart teams in the top 3 w #LFC 5th – passes muster pic.twitter.com/xSLb8Hixzc
— Ábel Mészáros 🇺🇦 (@BundesAbel) March 2, 2022
This is called the Buildup Disruption Percentage (BDP). The signs are always changed since the BDP is awarded to the disrupting team/defending team.
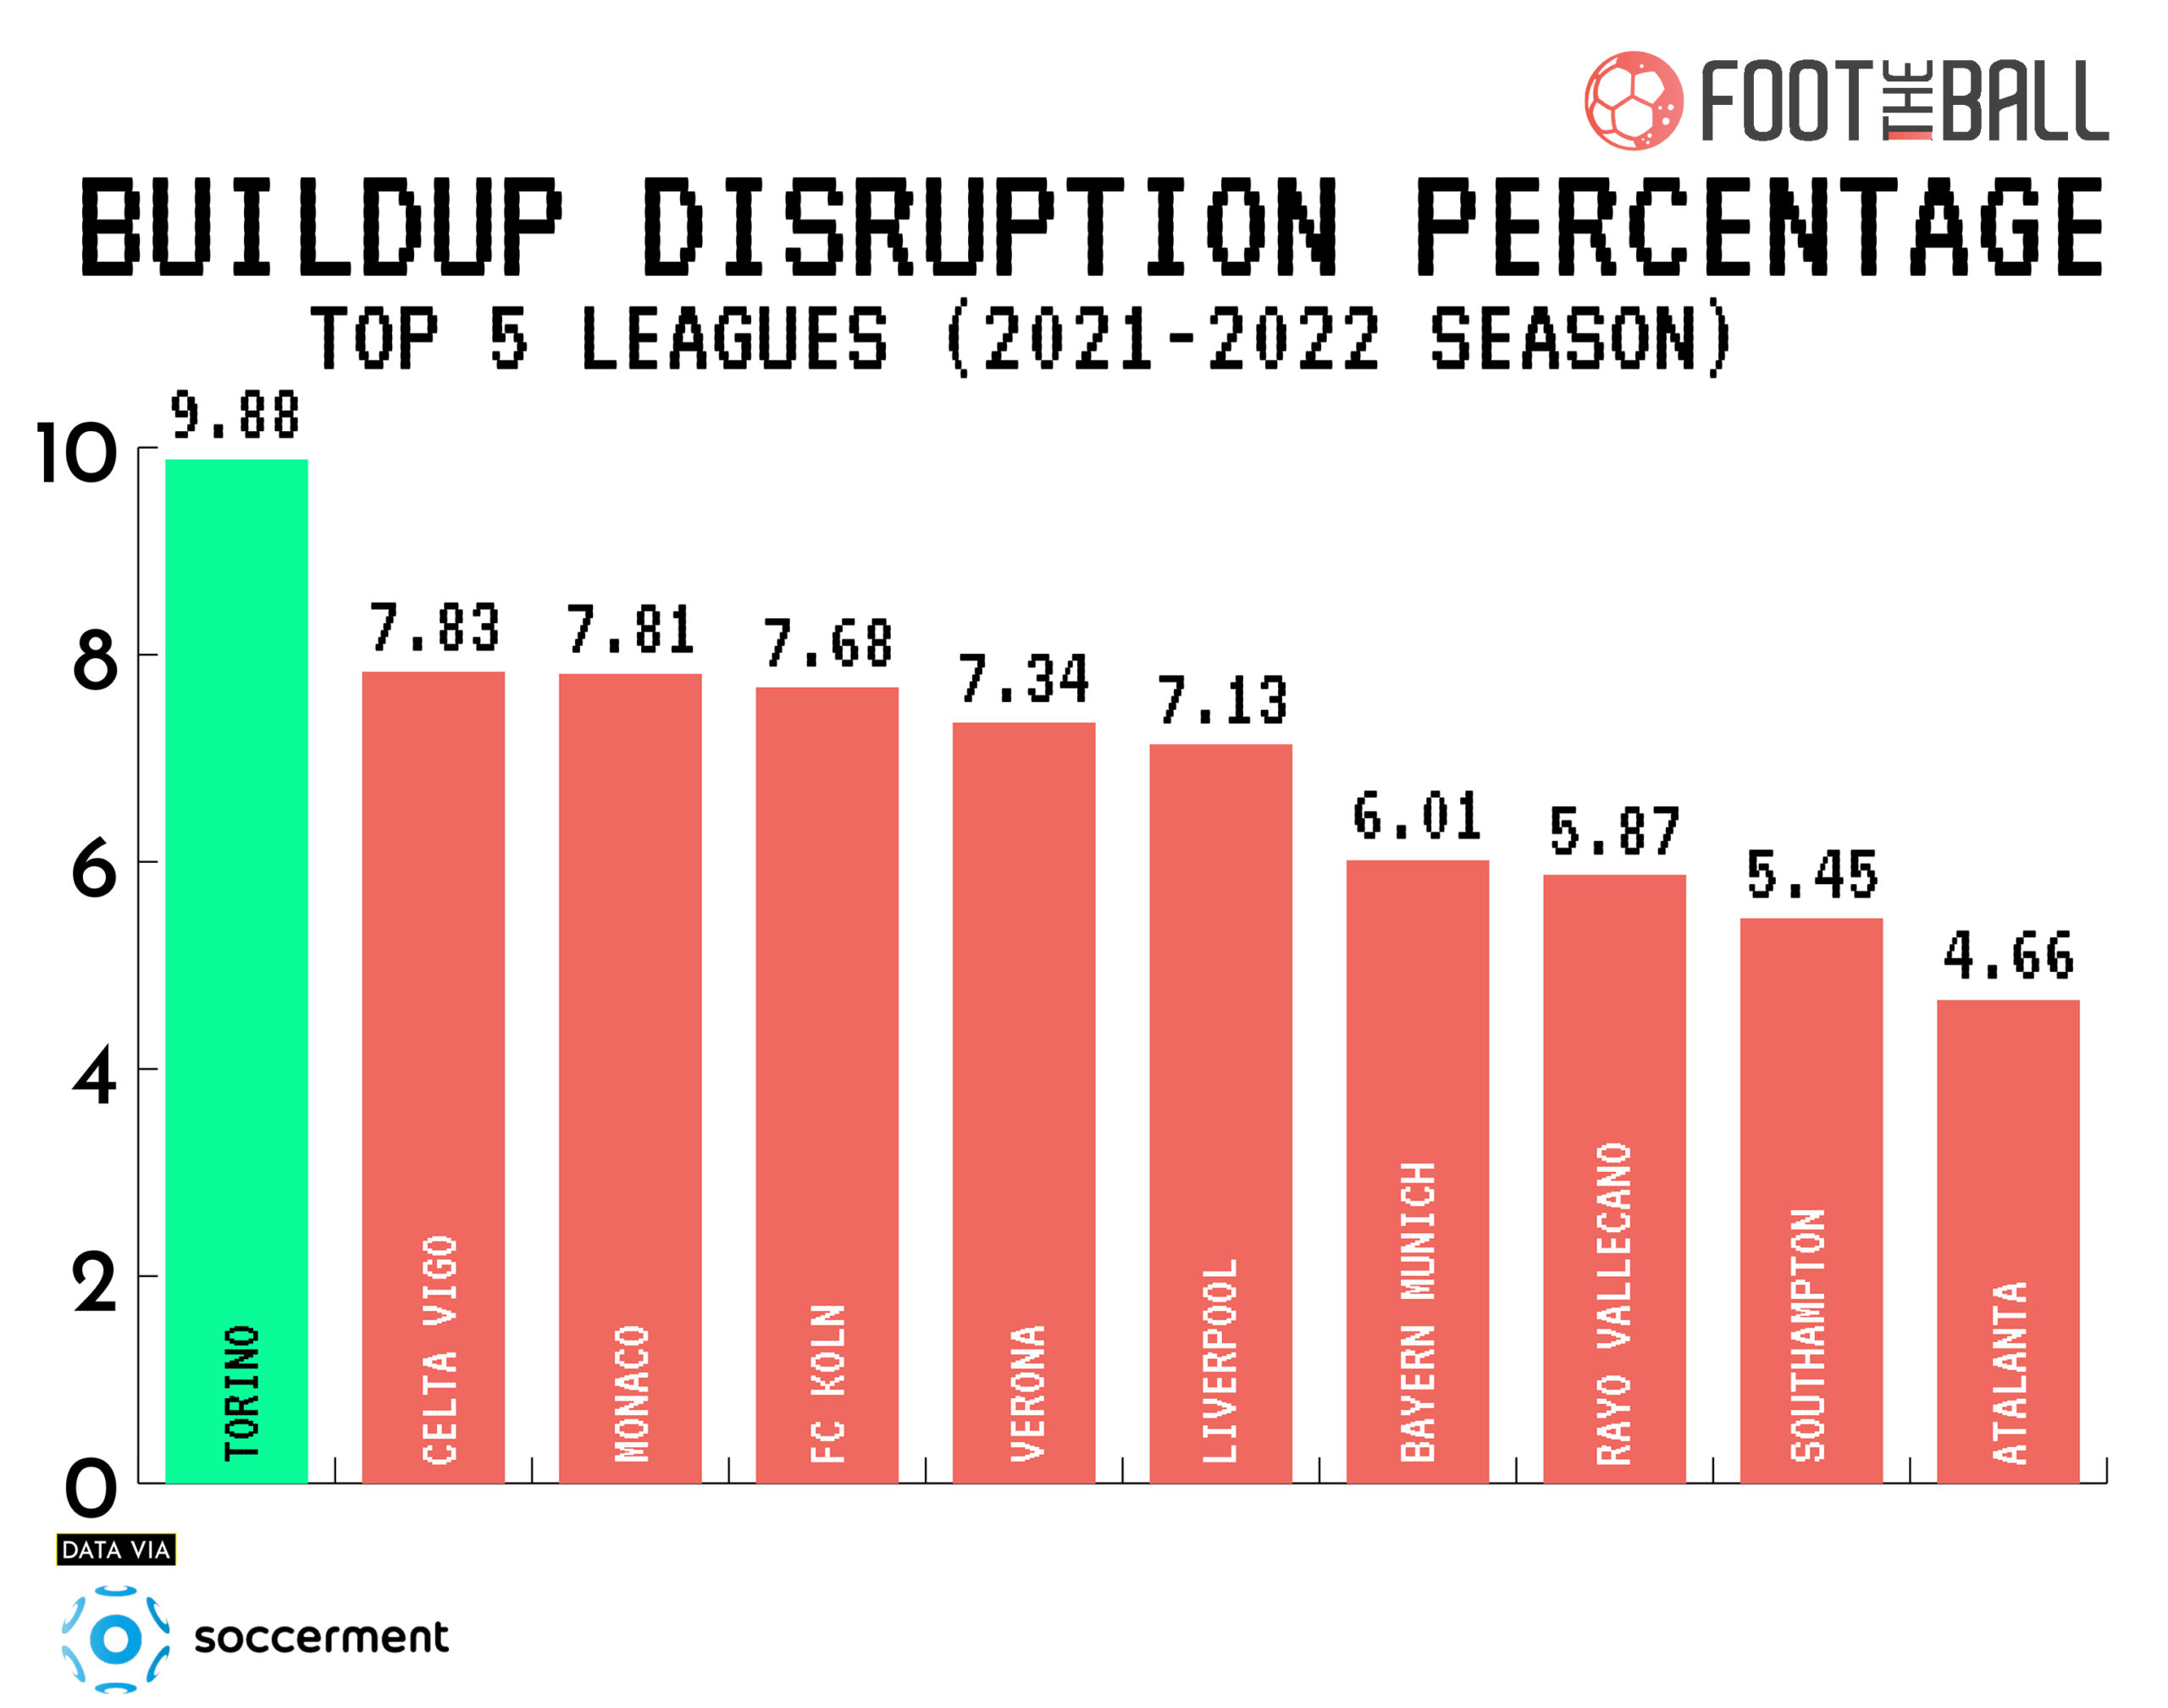
So, which team tops the BDP chart?
Across the top five leagues in Europe, Serie A side Torino dominated this metric last season. The Italian side had a BDP of 9.88 per cent. They were followed by fellow Serie A side Verona with Celta Vigo and Monaco taking the next two spots.
Last season, Torino went as high as 10.88 per cent, demonstrating their brilliant pressing.
However, just like the PPDA and other metrics, BDP may not give a clearer picture on its own.
So, Soccerment compared it to other states such as PPDA, fouls committed, and expected points per game.
Torino dominated outright when BDP was compared to fouls committed per game. This showed that their pressure led to players closing their rivals, resulting in fouls.
One of their key players last season was centre-back, Gleison Bremer. The Brazilian was rated as the best defender in Serie A by Soccerment. In addition, he was ranked second-best for heading and third-best for having won aerial duels. Ultimately, he was the subject of a bidding war in the transfer window with Juventus gazumping Inter to secure his services.
Genoa #BDP Buildup Distuption Percentage before and after #Blessin. Huge change in Press & Gegenpressing!
In this moment Genoa is second in Serie A behind Torino (10,6).All details here: https://t.co/poTTrsZjZW pic.twitter.com/kYsmh2O0o3
— Antonio Gagliardi (@toni_Gagliardi) February 28, 2022
An important thing to notice here is that Torino’s current coach Ivan Juric managed Hellas Verona before. And it’s a good analysis of what tactics he uses, considering he managed the top two pressing teams in Europe.
In fact, under Juric, Verona was the team with the highest BDP in the previous season.
Is Buildup Disruption Percentage flawless?
The short answer is no, and the long answer is only if it is looked at holistically instead of in isolation. For instance, if a team loses its top two midfielders who are highly skilled in pressing, the numbers are bound to drop.
There might be other factors such as any random event, or sending off that might affect the data. However, according to Soccerment, if we analyse the stats of the whole season, it will present a clearer picture.
And a look at Liverpool’s BDP proves their point. Jurgen Klopp’s men during their injury-plagued season, had a BDP of 7.13. This was despite the likes of Virgil Van Dijk, Fabinho, Gomez, Matip and others being ruled out of games. What this proved is that the system of Liverpool is defined, regardless of the players. The players playing might affect the result, but the identity is set. Eventually, with the return of their stars, Liverpool’s performances picked up and they finished 2nd last season, running Manchester City close.
The BDP does offer far more possibilities when analysing a team’s performance. Of course, it is not perfect like any other stat but has improved the world of football analytics.


