
How do we measure a player’s attacking contribution in numbers? There is a catch in every metric. Therefore, a solid and precise one was needed. It became one of the most challenging questions to answer in data analytics. Voila!!!! The Expected Offensive Value Added (xOVA). But before we dive into it, we need to have some backstory.
In football, there are players like Lionel Messi who can do it all. Their impact can be seen in their numbers. But some players can feel hard done by the stats. For years, the lack of a system for rewarding players involved in the build-up play frustrated data analysts.
For example, a creative midfielder was highly dependent on his teammate to score. Therefore, the player was only awarded the assist if the move ended with a goal. In case of failure, the player who made the pass did not get any statistical award. So, in short, a striker’s efficiency determined his and his teammate’s stats.
Also Read: What is Buildup Disruption Percentage or BDP, revolutionizing statistics
This happened until new metrics emerged that provided a better, more profound understanding of the game.
Metrics such as expected threats (xT) and xOVA have helped players get their share due.
Expected Offensive Value Added
The metric developed by data analytics site Soccerment has straightforward but practical reasoning. In a football game, after receiving a ball, the player has three choices- shot, pass, or take on an opposition player. The shooting and passing is the base for expected goals (xG) and expected assist (xA). However, just looking at xG and xA can create a flawed image in one’s mind.
The advanced metrics that we will integrate in our analytics platform in the next few weeks (top 5 leagues):
◆ xG
◆ xA (Pass-centric model)
◆ xOVA (🆕)
◆ xGoT and Goals prevented
◆ xPassesFor more info, our post (also available in Italian 🇮🇹):https://t.co/6fPc0OM26R pic.twitter.com/7FYCufnETT
— Soccerment (@Soccerment_Blog) August 12, 2021
For instance, a striker or an attacking player who spends more of his time in the attacking third will get the maximum opportunity to be involved in goals and assists. Meanwhile, some players such as fullbacks and central midfielders may have colossal assist figures but have low xG due to their position.
Also Read: How ‘Field Tilt’ has changed the way attacking intent is measured
There was no clear metric that could bridge this gap between the players, until now.
This is what xOVA aims to do.
xOVA = (non-penalty xG + xA) – xA received
The formula for calculating xOVA is simple. Take a player’s non-penalty xG and add xA to it. It gives us the total contribution of a player in the offense. Then, xA is subtracted from this sum to negate their positional advantage. This shows the offensive value that a player brings to the team instead of the value received from his teammates.
xOVA also takes two things into account. Firstly, it calculates the chance created on the quality of a shot or pass rather than their outcomes. So, a player will get his fair share of rating for an assist irrespective of the fact his teammate scores or not. Secondly, the xOVA is calculated on a ‘pass-centric’ approach to xA and not a ‘shot-centric’ one to gauge a player’s offensive abilities better.
xOVA comparison to understand better
For example, if we look at the xOVA ratings for the EPL, we find some interesting observations., The second and third-ranked players last season were Liverpool’s Trent Alexander Arnold and Tottenham’s Harry Kane. However, while Kane is an out-and-out attacking player, Alexander Arnold is a right-back.
Also Read: What is Passes per Defensive Actions or PPDA?
So, let’s apply the xOVA formula on these two players as an example (Figures to give an idea of the metric, not accurate to the point)
Kane’s non-penalty xG is 14.20 and his xA is 5.13. This adds up to 19.33.
Meanwhile, Alexander Arnold’s non-penalty xG is a meagre 1.80 while his xA is 12.08. This adds up to 13.88.
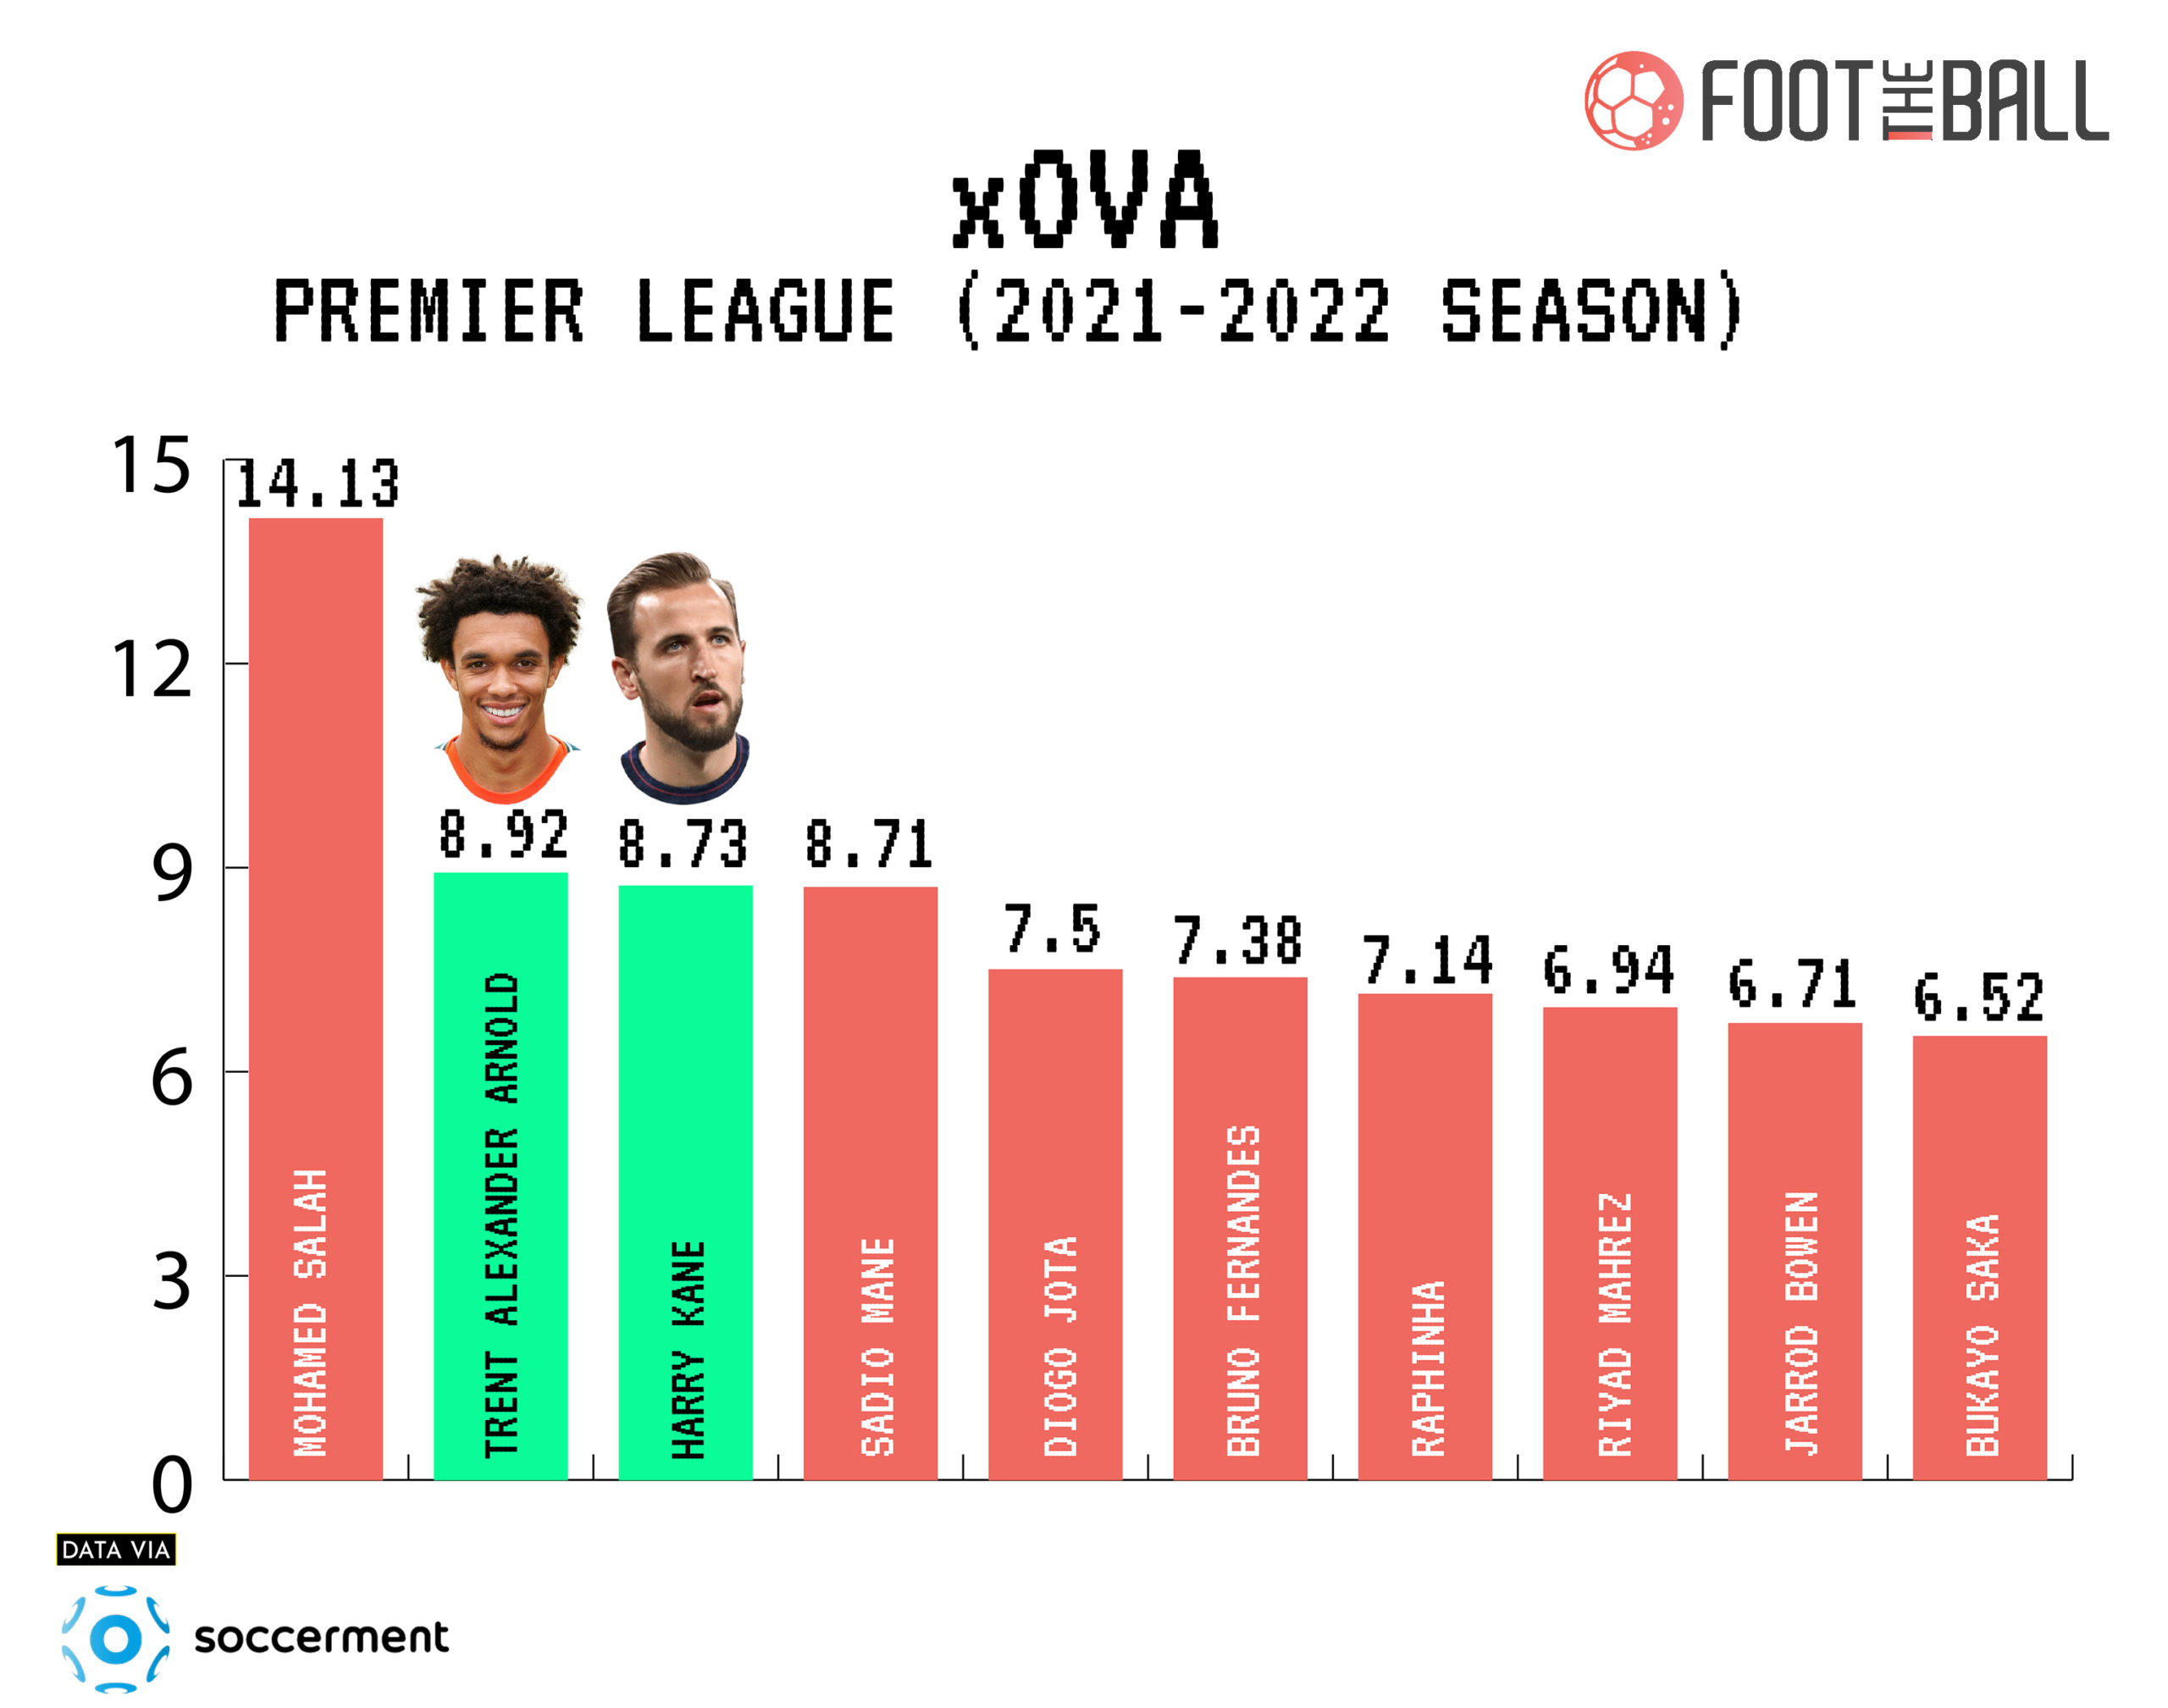
This is where the xA received comes into play, which makes xOVA such an effective rating.
After subtracting the xA received for both players, Alexander Arnold has an xOVA rating of 8.92 while Kane’s score is 8.73.
So, the xA received negated Kane’s advantage in goals and his involvement in attacking areas as a striker. Meanwhile, Alexander Arnold’s expected assists received were low which helped him counter Kane’s advantage in goals.
But since Kane is a striker, his xA received will be high as teammates will be feeding him the ball to score. In contrast, Alexander Arnold will have a low xA rating as he is a defender that rarely ventures into high-scoring areas.
Harry Kane’s xOVA = (14.20 + 5.13) – 10.6 = 8.73
Trent Alexander Arnold’s xOVA+ (1.80 + 12.08) – 4.96 = 8.92
This is the biggest validation of xOVA as a stat. It normalises the positional advantages/disadvantages in the game to give the most accurate metric to measure the offensive contribution of any player.
After some initial pushback, xG is now a stat that is covered even by broadcasters in their match coverage. xOVA might one day tread that same line.


