
What is the correct metric to measure a player’s offensive contribution in a football game? Is it goals, assists, expected goals, expected assists? While we may never find a perfect answer to the question, one metric comes close. Expected Threats (xT) works on a simple but effective thought process. For example, if a player has a ball at his feet in a specific part of the pitch, what is the likelihood that the ball may end up in the back of the net after some moves. This is what xT aims to do.
Under the metric, the aim is to sense the action just before a key pass, a brilliant through ball to see a pattern. This helps in identifying players who are the chief creators of the team. The xT model is an improvement on the previously xG chain model, which had limitations. In the previous model, the same value was assigned to every player in the move before the assist. However, it didn’t distinguish between the quality of the passes and the vision of a player who did the most challenging job while creating the goal. So, it would be hard to identify the real creative genius.
So, how does the xT model work?
What is Expected Threat (xT)?
First, we must get the math out of the way. The formula for deriving xT was developed by Karun Singh in his blog in 2018. He divided the entire football pitch into grids. In football, after getting a ball, a player has two options, either shoot or move the ball into a different grid through passing or carries.
So Karun Singh calculated the shooting probability and moving probability from each grid. So, for example, a grid inside the penalty box will have a high shooting probability compared to, say, the middle of the pitch.
Using this methodology, he first calculated the number of times a player shot from a grid and multiplied it by the goal conversion rate from that grid. Then he figured how often a player would move or pass the ball to a different grid. The second value was called the transition matrix. So, you multiply the shooting probability by the conversion rate, add it to the moving likelihood, which has been multiplied by the transition matrix and xT grid.
This led to the creation of the xT formula, which is as follows:
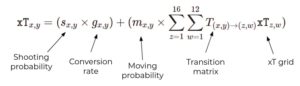
Source: Soccerment
This gives us the most accurate ratings for a player’s offensive contributions. The xT metric has been further divided into two parts, xT from passes and xT from carries.
Gather around fellas. Manchester United have finally signed a good centre back
The need for xT
Imagine a situation in which a team is facing a corner. They clear it after a player X conjures up a brilliant pass that puts his teammate Y through on goal. The player takes the ball towards the goal and as the goalkeeper comes forward calmly squares the ball to another teammate, Z, who scores into an empty goal.
What would the stats say after that match? First, Y would get one assist, and Z would get a goal to his name. But what about X? At best, he would be getting a mention in the xG chain model, which, as we discussed, was already flawed.
So, how do we justify X’s talent? By using the xT model.
🚀 Release mplsoccer 1.1.1
🎯 turbine charts
📐 Delaunay triangulation
💎 expected threat tutorials
💿 a better StatsBomb parser (including API)
🚩corner arcs and linestylehttps://t.co/G7gMl5Mb7X pic.twitter.com/qDu0uunXbC— Andy Rowlinson (@numberstorm) July 8, 2022
Applying the xT model to the model above X would benefit immensely. The grid from where he conjured up the pass in his half would already have a meagre chance of scoring or making a brilliant pass. This would fetch him a very high xT value and do justice to his contribution.
So, who are our top performers in the xT model?
Seems like everyone is rejecting Chelsea these days. So, will the Blues finally get Jules Kounde to buck that trend
xT – Top performers
As we mentioned, xT is divided into two parts, passes and carries. Regarding carries, the winner is Real Madrid’s Vinicius Jr. The Brazilian, playing in tandem with Karim Benzema, formed a deadly attack that won the La Liga and the Champions League.
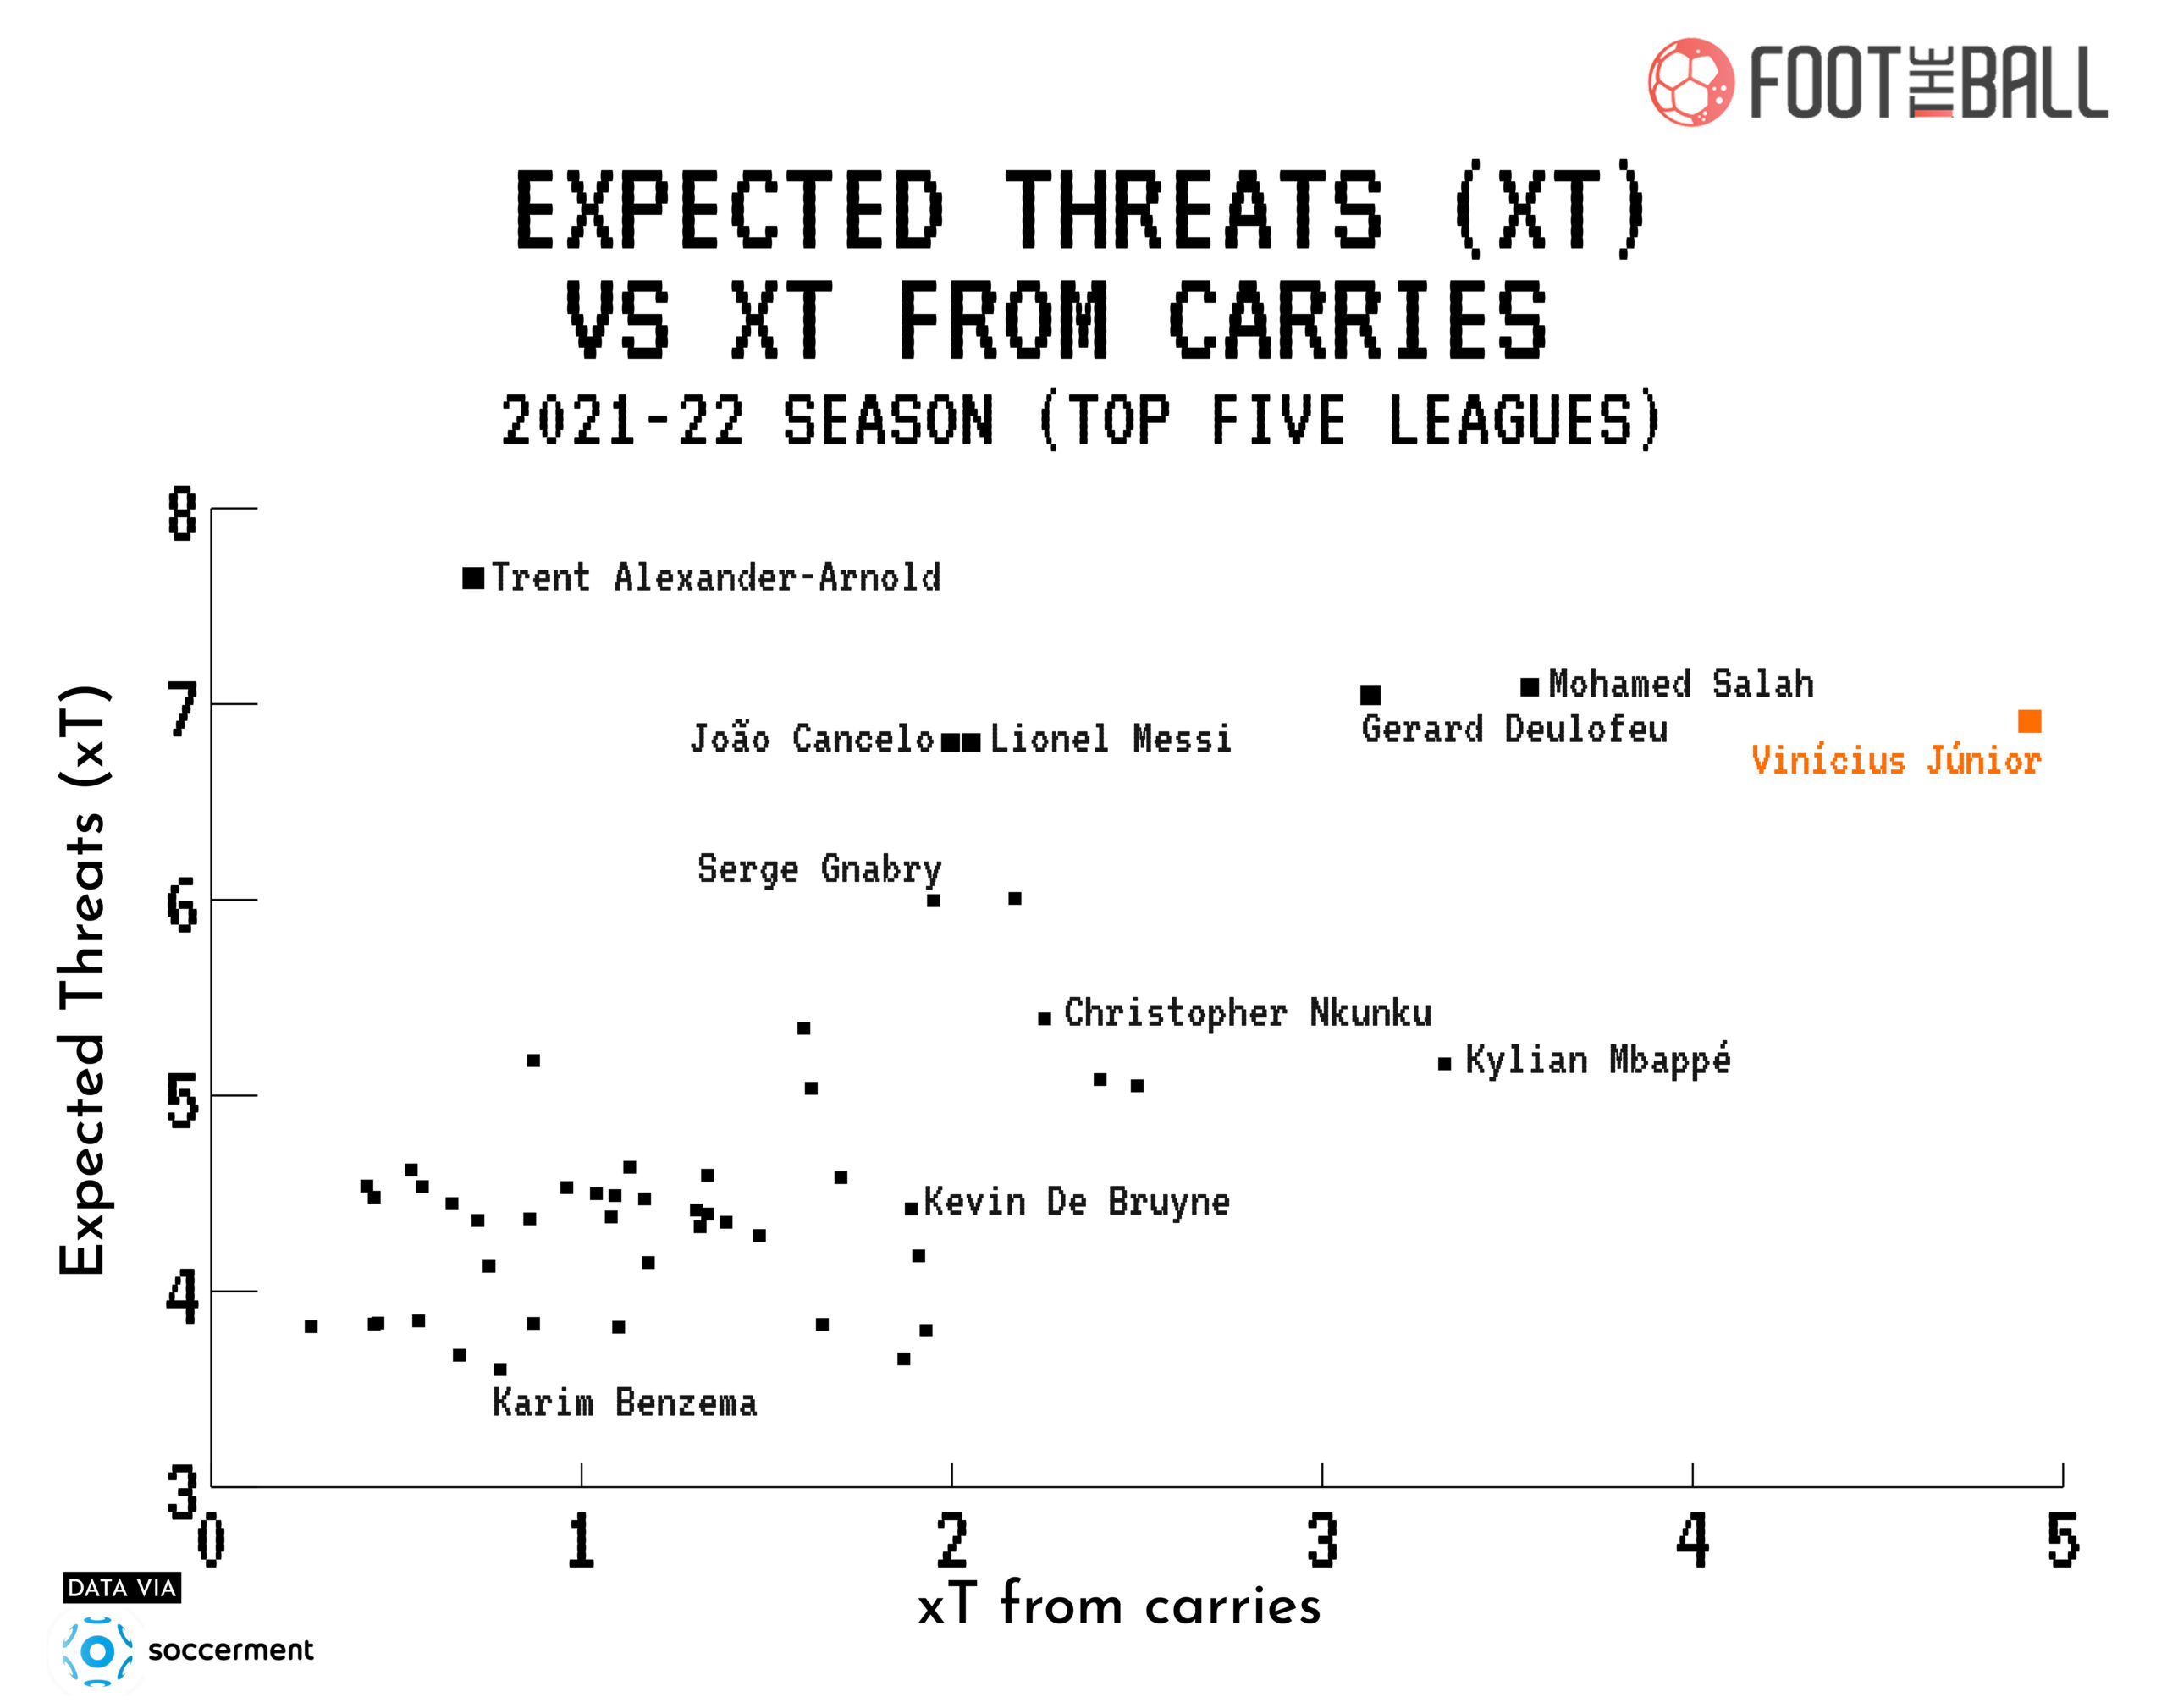
The 22-year-old left established stalwarts such as Mohamed Salah and Kylian Mbappe behind. A surprise entry to the list was Manchester City’s Joao Cancelo, whose xT from carries numbers were at par with Lionel Messi.
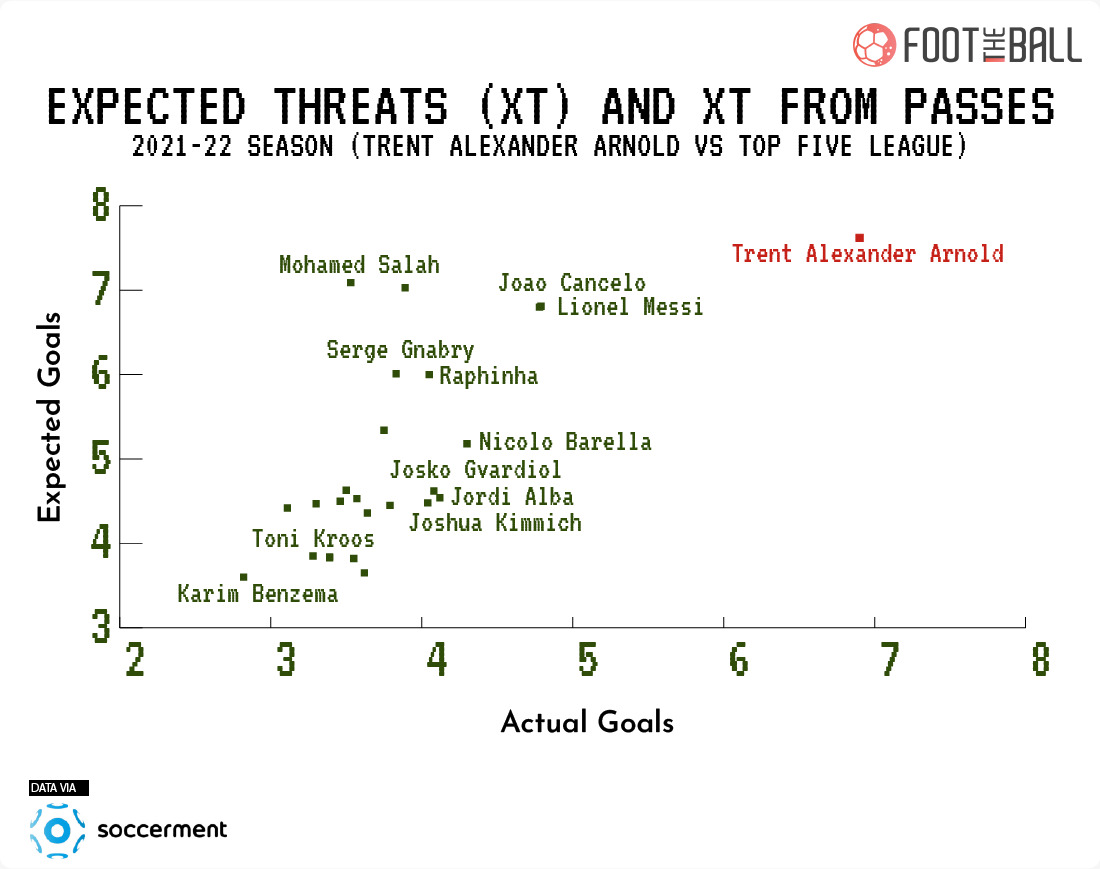
And when it came to xT from passing, Liverpool’s Trent Alexander Arnold was the king. The Englishman was far ahead of the nearest competitors, Lionel Messi and Joao Cancelo.
Trent Alexander Arnold has also been a top performer in the Expected Offensive Value Added (xOVA) metric.
Meanwhile, Cancelo is one of the few players who has been a force through his passing and carries.
Other players to shine in the metric are Gerard Deulofeu (carries), Son-Heung Min (carries), Rafael Leao (carries), Raphinha (passes), and Josko Gvardiol (passes).
The xT model still needs perfection, which will be achieved as more data gets integrated into football. However, the current model offers a brilliant insight into the game. Another exciting thing is that xT is perhaps the perfect metric that can be integrated into coaching players and adapting them to a particular system.


